
Every LED spec sheet you will ever be handed prints a CRI number. It is almost always “80” or better, and there is almost never an R9 next to it.
R9 describes a saturated-red sample separately, and it is the index most often left off a datasheet. A general rendering score that averages eight pastel samples can look healthy while saturated red is reproduced poorly. Leaving it off is a reporting choice; it is not by itself evidence of a defect.
Ra summarizes the rendering of eight moderate-color test samples; R9 describes a saturated-red sample separately. Neither number, on its own, tells you whether a lamp is suitable for a specific task. Our archive holds 165 white-light integrating-sphere reports, each one carrying a measured Ra and a measured R9. In this archive, 134 of the 165 (81.2%) record R9 = 0. The rest of this article explains what those numbers mean, what they cannot tell you on their own, and what to ask for when color identification matters.
- Dataset
- 165 white-light reports
- Equipment
- Integrating sphere
- Measurement
- Ra & R9 from spectrum
- Source
- DXZ in-house archive
- CRI is a system; Ra is one number inside it. Ra is the arithmetic mean of eight moderate-color test samples (R1–R8). It does not include R9, the saturated red sample — commonly the weakest sample in a white LED.
- Across our 165 white-light sphere reports, measured Ra runs from 64.0 to 82.2, with a median of 71.4 and a standard deviation of 3.67.
- Two-thirds of the archive (69.1%, 114 of 165) measures Ra 70 or above. Only 2 reports (1.2%) reach Ra 80, and none reach Ra 90.
- R9 = 0 in 134 of 165 reports (81.2%). The highest R9 anywhere in the archive is 29. These are the values recorded in our own archive, and we publish them rather than omit them.
- Our data does not show a strong Ra-versus-efficiency trade-off. The correlation between measured Ra and measured luminous efficacy is r = −0.11 — weak. We report it as a weak trend rather than dress it up as a rule.
- Ra and R9 tell you about color fidelity, not brightness, beam shape or reliability. In the products this archive covers they are rarely the design driver — but that is a statement about this archive, not about every application.
On this page
What CRI Actually Measures
The number everyone actually quotes — “CRI 80” — is Ra, the general color rendering index. Ra is not a single measurement. It is the arithmetic mean of eight test samples, numbered R1 to R8. Those samples were chosen to represent moderately saturated pastel tones: light grayish red, dark grayish red, strong yellow, moderate yellowish green, light bluish green, light blue, violet, and light reddish purple.
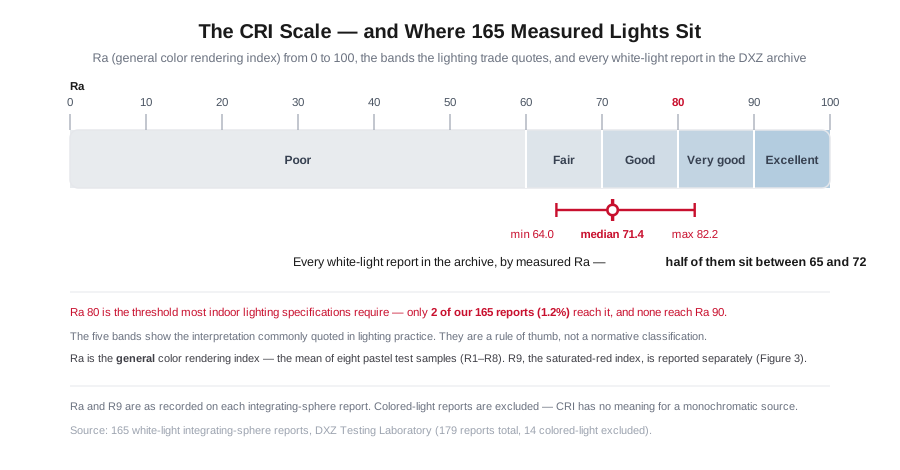
So “CRI 80” is an average over eight pastel patches — and averages hide things. The lighting trade has long used a rough reading of the scale, shown in the bands above: below 60 poor, 60–70 fair, 70–80 good, 80–90 very good, 90 and above excellent. That reading is a rule of thumb, not a normative classification. The standard defines the calculation, not the adjectives.
One consequence is worth stating plainly before we go further: Ra is a measure of color fidelity for pastel tones only. It says nothing about saturated colors. It also says nothing about the properties that decide whether a light works on a road — output, beam shape, glare control or durability.
Why Ra Alone Hides R9
CRI does not stop at eight samples. CIE 13.3 — the method behind Ra — defines fourteen special color rendering indices, R1 through R14: the eight general samples plus six additional ones. R9, the saturated red sample, is the first of those six and the one most often reported on its own. Our instrument prints one further index, R15. That extension is not part of CIE 13.3, so we count it separately.
The most important of them is R9 — the saturated red sample.
It is excluded from Ra on purpose. Averaging a violently saturated red into a set of pastel tones would make the general index swing wildly, so the standard keeps it separate. The practical result: a spec sheet can report Ra 70 while the same lamp reproduces saturated red at zero.
That is not a rounding error. One lamp renders a red warning triangle, a red cable jacket or a red fluid marking faithfully. The other turns all of them into a muddy brownish gray.
- Instrument
- Integrating sphere with spectrometer — the lamp’s spectrum is measured and the colour shifts of the standard test samples are computed from it.
- Reference
- CIE 13.3 colour-rendering method. Ra = arithmetic mean of the eight general samples (R1–R8); R9 = the saturated red sample, measured but excluded from Ra. CIE 13.3 defines 14 special indices; the R15 value our instrument prints is an extension outside that method.
- Scope
- 165 white-light reports. The 14 coloured-light reports in the same archive are excluded — CRI is undefined for a monochromatic source.
- Efficiency link
- Pearson correlation between measured Ra and measured luminous efficacy (lm/W). All 165 white-light reports carry a valid luminous-flux value, so the paired analysis count is also 165.
- Repose
- Every figure is traceable to a dated, signed report in the DXZ archive.
What 165 Measured Reports Show
Here is our own archive. Across 165 white-light integrating-sphere reports — the 14 colored-light reports in the same archive are excluded, because CRI has no meaning for a monochromatic source — the measured general color rendering index is:
| Metric | Value |
|---|---|
| Reports | 165 |
| Minimum Ra | 64.0 |
| Median Ra | 71.4 |
| Mean Ra | 71.7 |
| Maximum Ra | 82.2 |
| Standard deviation | 3.67 |
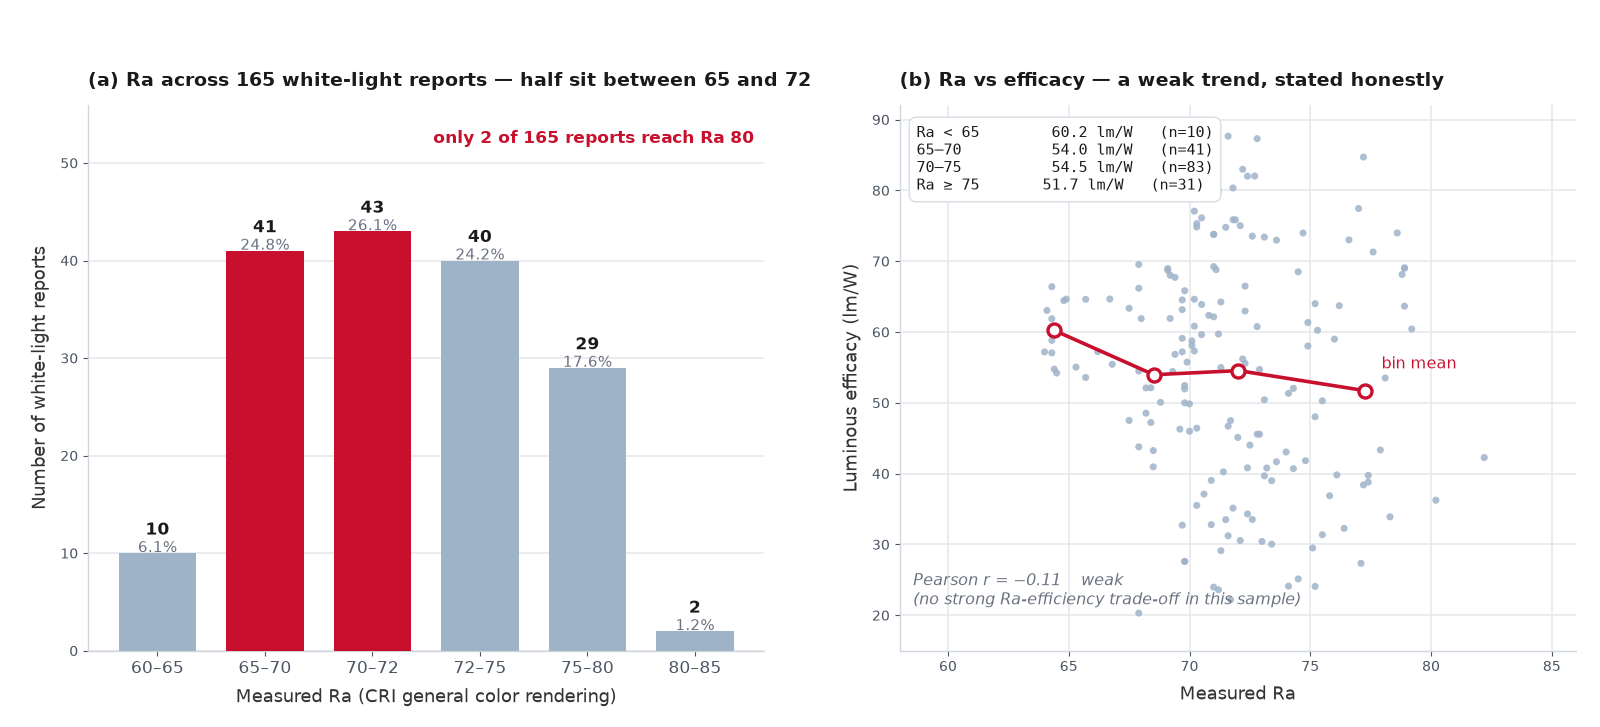
The distribution is tight. 85 of the 165 reports (51.5%) measure between Ra 65 and Ra 72, and 124 (75.2%) land between 65 and 75. Two-thirds of the archive (69.1%) reaches Ra 70. Above that the tail falls away fast. Only 2 reports in the entire archive reach Ra 80 (1.2%), the highest being 82.2 on a 5924 K white variant — and not one report reaches Ra 90.
The R9 Result We Publish Anyway
Now the number the datasheets leave out.
Across the same 165 reports, R9 is recorded as 0 in 134 of them — 81.2%. The instrument prints whole numbers, and no report in this archive records a negative R9. The remaining 31 records are not dramatically better. The highest R9 anywhere in the archive is 29, the mean across all 165 is 2.2, and the standard deviation is 5.4.
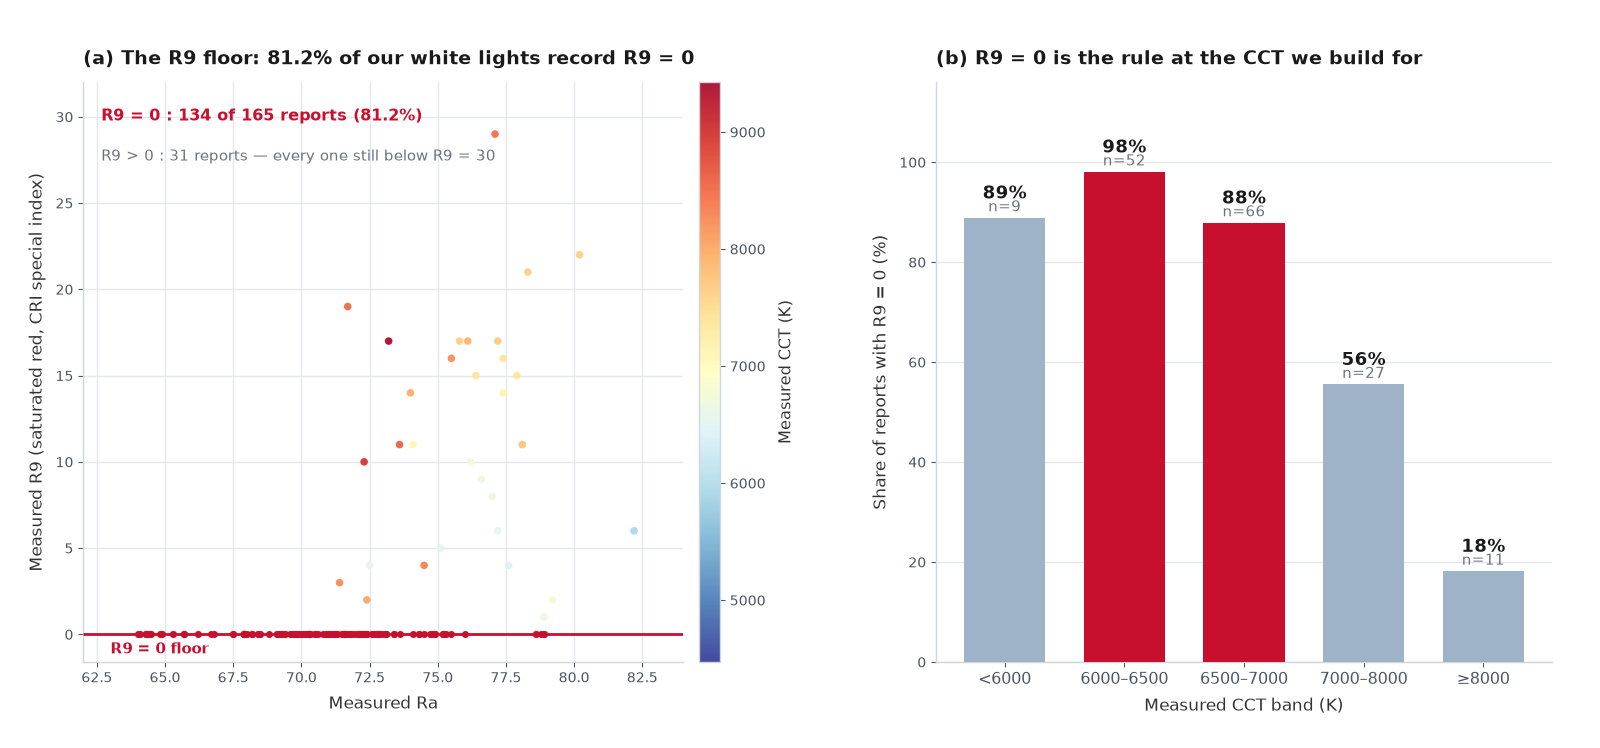
Panel (a) is the honest picture. Every one of the 165 reports is a dot. The red line along the bottom is not an axis — it is where the points actually are. The archive has a recorded floor at R9 = 0, and four out of five reports sit on it.
Two things are visible in that plot that a summary statistic would hide:
- The reports with R9 > 0 are also the ones with higher Ra. The R9 = 0 group has a median Ra of 70.7; the 31 reports with any R9 at all have a median Ra of 76.4 — a gap of about six points. High rendering in our archive travels together: when the red sample works, the pastel samples tend to work too.
- Where R9 is recorded as zero varies with color temperature. Panel (b) splits the archive by measured CCT. In the 6000–6500 K band, 98.1% of reports (51 of 52) record R9 = 0. Move cooler, past 8000 K, and the share drops to 18.2% (2 of 11). Several of those bands hold only a handful of reports. The percentages are real, but the sample is small — and we would rather show you the counts than let a bar chart imply more than it proves.
The mechanism is well understood. White LEDs are made by pumping a blue emitter through a phosphor blend. Pushing for more output and a cooler color temperature shifts that blend toward yellow-green. The red component — the part that would raise R9 — is what gets traded away. That is a general property of phosphor-converted white LEDs. Whether a particular product behaves this way has to be read from that product’s own report, not assumed from this archive.
Which is why we print both numbers. A report that gives Ra 71.4 and R9 = 0 has told you more than one that gives only “CRI 80”. If your application depends on saturated red, the R9 column is the one to read first. And if it does not, you now know what the number was telling you — and what it was not.
Does Lower Ra Really Cost Efficiency?
The obvious explanation for a low Ra is that the manufacturer sacrificed rendering for output. We went looking for that trade-off in our own data, and the honest answer is that we did not find a strong one.
Plotting measured Ra against measured luminous efficacy across the archive gives a Pearson correlation of r = −0.11. In plain terms: weak. The direction is right — efficiency tends to fall as rendering rises — but the scatter is wide and the relationship explains very little.
| Ra group | Reports | Mean efficacy |
|---|---|---|
| Ra < 65 | 10 | 60.2 lm/W |
| 65 ≤ Ra < 70 | 41 | 54.0 lm/W |
| 70 ≤ Ra < 75 | 83 | 54.5 lm/W |
| Ra ≥ 75 | 31 | 51.7 lm/W |
Read the middle two rows. They are 54.0 and 54.5 lm/W — close to each other, and both well below the low-Ra end. The apparent trend is carried largely by the two ends, and the low-Ra end holds just 10 reports. We are not going to present a 10-report group as proof of a physical law.
There is a real design trade-off in LED phosphor engineering — that part is well established. What our data says is narrower, and we will say only this much: within the range of products we build, Ra and efficacy are not strongly coupled. If you are choosing between our models, you are not choosing between brightness and rendering fidelity in any meaningful way.
- Ra describes pastel colour fidelity only. R9 — the saturated red sample — is excluded from Ra by definition.
- CRI is undefined for monochromatic light; the 14 coloured reports in the same archive are excluded from every statistic here.
- The Ra-vs-efficacy trend is weak (r = −0.11) and is reported as weak. The low-Ra end holds only 10 reports, which we will not present as proof of a law.
- Ra and R9 say nothing about brightness, beam shape, glare control or durability.
Which CRI Do You Actually Need
This section is engineering guidance, not measurement — and we are labelling it as such.
| Application | Rendering need | Why |
|---|---|---|
| Off-road and long-range spot | Low | You are judging distance and contrast, not color |
| General road driving | Low | Sign and lane reading depends on luminance and glare control |
| General work lighting | Check against the task | Ra 70+ is often quoted for comfort over long sessions; verify it for your own task rather than assuming it |
| Cable, coating, fluid-marking identification | Request Ra and the relevant special indices | Distinguishing saturated red from its neighbors is where R9 matters most |
| Retail, display, studio | Very high (Ra 90+) | The colors are the product |
The pattern is simple: the more your task depends on telling colors apart, the more Ra and R9 matter — and the less your task looks like driving.
If your application is on the high end of that table, ask for the per-model Ra and special-index data before you specify. For the everyday segment, start from our LED work lights range and request the measured values for the exact model you are considering.
FAQ
What is CRI?
The Color Rendering Index — a 0–100 scale for how faithfully a light reproduces object colors compared with a reference illuminant of the same color temperature. It is calculated from measured spectral data, not estimated.
What is Ra?
The general color rendering index: the arithmetic mean of the first eight test samples, R1–R8, which are moderately saturated pastel tones. When a datasheet says “CRI 80”, it almost always means Ra 80.
What is R9, and why does it matter?
R9 is the saturated red special color rendering index. It is measured but excluded from Ra, which is why a lamp can score reasonably on Ra and still be poor at red. In our archive, 81.2% of white-light reports record R9 = 0.
Is a CRI of 70 bad?
It depends on the task. Ra 70 sits in the “good” band of the conventional reading, but that reading is a rule of thumb, not a standard. If users must distinguish colored cables, markings, coatings or materials, request the actual model’s Ra and relevant special-index data, and validate color discrimination in the intended setting. For general illumination, beam distribution, illuminance and glare usually matter more than Ra.
Why is R9 often 0 in LED lights?
White LEDs are blue emitters with a phosphor blend. Pushing for higher output and higher color temperature shifts the blend toward yellow-green, and the red component that raises R9 is what gets traded away. That is a general property of phosphor-converted white LEDs, but whether a specific product behaves this way has to be read from that product’s own report.
Do I need high CRI for a work light?
It depends on the task. If the work involves distinguishing colors — cable jackets, coatings, fluid markings, safety markings — request the model’s Ra and relevant special-index data, and test color discrimination in the intended setting. For pure illumination at distance, lux and beam distribution matter far more than Ra.
What CRI do off-road and driving lights have?
In our archive, a median Ra of 71.4, with R9 recorded as zero in 81.2% of the white-light reports. That is the profile of the reports we hold; it is not a claim about other suppliers’ products, and not a statement about what every application needs.
Is Ra the same as CRI?
Not exactly. CRI is the whole system; Ra is the general index inside it, and the one most often quoted as “CRI”. The two are used interchangeably in practice, which is part of why R9 gets forgotten.
Does a higher CRI mean a dimmer light?
Not in any strong sense. Across our 165 reports the correlation between Ra and luminous efficacy is only −0.11 — weak. There is a real design trade-off in phosphor engineering, but it is not strong enough in our product range to treat “high CRI” as automatically costing you output.
How is CRI measured?
In an integrating sphere: the lamp’s spectrum is measured, the color shifts of the standard test samples under that spectrum are computed, and the indices are derived from those shifts. Every figure on this page comes from that instrument, in our own laboratory.
What is the highest CRI in the DXZ archive?
Ra 82.2, on a 5924 K white variant. Only 2 of our 165 white-light reports reach Ra 80, and none reach Ra 90. The highest R9 in the archive is 29. If a project needs a defined rendering level, ask for the measured data on the specific model rather than assuming it from this archive.
Research snapshot and citation
- Research topic
- CRI, Ra and R9 in selected white-light LED reports
- Dataset size
- 165 white-light integrating-sphere reports with measured Ra and R9 values described on the page.
- Measurement subject
- Colour-rendering values derived from the measured spectrum, including Ra and the separately reported R9 sample.
- Source
- DXZ in-house archive and the source evidence described on this page.
- Scope
- Selected DXZ white-light reports; the 14 coloured-light reports in the same archive are excluded from the CRI analysis.
- explain the distinction between Ra and R9
- show the reported colour-rendering observations and efficacy groupings within the selected archive
- establish a universal CRI/R9 requirement for every application
- claim suitability, regulatory compliance, or market-wide performance from this archive alone
DXZ Laboratory. Understanding Ra and R9 in DXZ LED Test Reports. DXZ Lighting. This resource summarizes measured Ra and R9 values from 165 white-light integrating-sphere reports.
Ordinary linking and citation are welcome. Please contact DXZ before republishing charts, tables or images; this page does not grant image-republication rights.
Research / technical enquiry: For questions about the dataset scope or a request for technical evidence, use the DXZ contact page and reference this resource URL.
Including the ones a datasheet would have left out. If you’re specifying lighting and need the measured rendering data behind a product line — Ra, R9 and chromaticity per model — ask us for the photometric data pack.